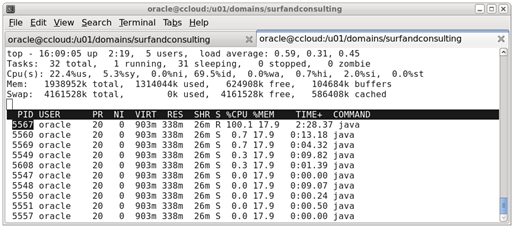
I captured the following webcast last night. I was writing about how a clever combination of simple tools like ps, top and jcmd can help to track down the Java code that is causing a thread to consume a high amount CPU time.
The approach is very generic and works for WebLogic, Glassfish or any other Java application. UNIX commands in the example are run on CentOS, so they will work without changes for Oracle Enterprise Linux or RedHat.
Creating the thread dump at the end of the video is done with the jcmd tool from JDK7.
The webcast uses the StuckThreadForFree sample application which is specific for WebLogic 12c and can be downloaded from my stuck thread recipe.


 Oracle WebLogic Server 12c Book
 Oracle Middleware and Cloud Computing Book
Hi Frank.
It’s a nice post.
I would like to share an other post where a friend of mine (http://claudius.com.br/) shows a bash script that do something like you shown here. This script is very useful because it attach to a running JVM process and print the top 10 cpu consumer threads to the console output. The script uses basically top, jstack and awk comands. Jstack is provided by JDK 5 and 6.
see the post here: http://claudius.com.br/2012/05/which-java-thread-consumes-most-cpu/
The script is code is available here: http://code.google.com/p/claudius-alphaworks/source/browse/trunk/shell_bin/top_threads.sh
Thanks.
Hi Rafael,
thanks for your comment and the link to the script!
I’d love to increase the amount of devops postings and information closer to the OS and scripting here.
jstack is gone in JDK7, the replacement is the jcmd (similar from what we know from JRockit)
so you might want to make your script future ready 😉
keep commenting and have a great day!
Frank