Java Class Not Found Exception / Could Not Find Class

Class Not Found

Could not find or load main class

You compiled your Java HelloWorld.java and then you are facing an error? Most likely you added the .class extension when the running the programm:

$ java HelloWorld.class
Error: Could not find or load main class HelloWorld.class

You were running the .class file. Try again:

$ java HelloWorld
Hello, World

Deal with ClassNotFound Exception

If you encounter a class not found exception while working with Oracle WebLogic server I recommend my posting about the Classloader Analysis Tool.
Detect your Memory Leaks by counting Surviving Generations: Size matters!

The sunshine motivates me to run more these days. Just back from a beautiful run in Englischer Garten I am still sweating but I am also inspired by Rene’s article about JRockit that I read last night. It’s a very detailed article and well done – I tempted to write ‘as good as usual’ but I do understand how much work it is!

Java Memory Leaks

Most likely there is no training I do on behalf of Oracle without the subject “memory leaks”. So while still cooling down from my run, let me add a few points about memory leaks.

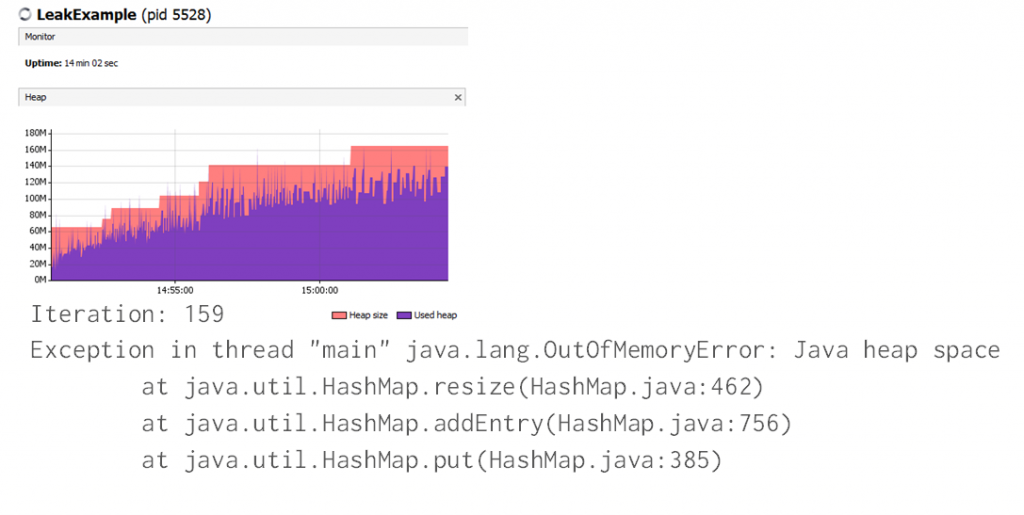
Size matters. At the end it is all about size! Wasting 20 bytes due to a mem leak is bad. Yet 20 bytes don’t affect your system. I bet you will neither notice nor detect it.

Wasting 20 bytes in a loop that runs a million times makes you probably notice the leak. Running the same loop with the leak 10 million times might crash your appserver.

Fast growth is not the issue. Slow growth is bad enough. Imagine you lose 20 bytes every minute. It’s a bit like a slow puncture tyre which constantly loses a bit of air. At the very end you sitting there with a flat tyre (Let me assume you life in a country with a mild climate and friendly people who will assist you to get the tyre changed quickly) . The same happens with your WebLogic heap. It’s not a lot of memory that you lose per time but it is the total size of the memory that is wasted over time. At the end your server will fail after three weeks (and WebLogic nodemanager restarts it for you ๐Ÿ™‚ ).


Don’t get me wrong. I am a big fan of JRockit, the team behind JRockit and its superb tools. Yet for a long time I wondered why JRockit’s memory leak tools still tries to detect “growth”.

Often I like to demo a 20 line Java program with 2 methods (mine is derived from the IBM page here, so you can get an idea). One method is consuming a lot of memory. The other one is losing 20 bytes every now and then. Of course the memory leak is within the second method, but JRockit tools detects the first method (which just happens to be mem intensive but correct).

Good news is: there is a better approach! It’s the kind of tools I love to explain in my workshops. Now it’s within the Oracle eco-system anyway but I used to spread the word long before.

Visual VM / Netbeans

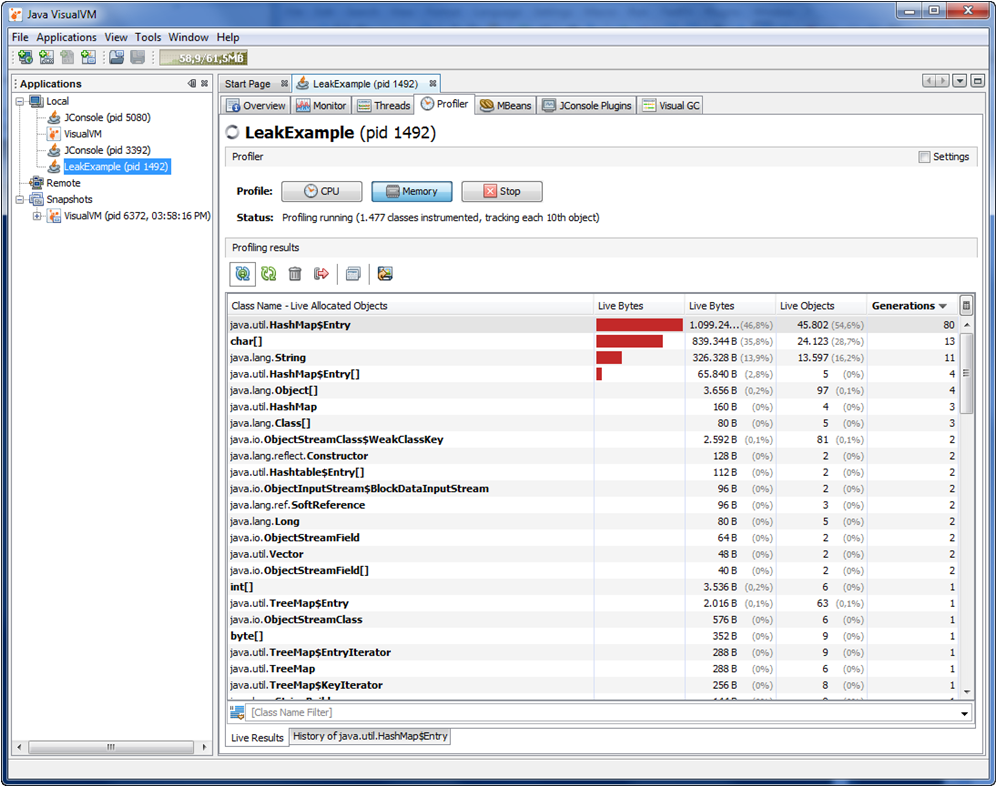
VisualVM comes with your Sun JDK6 for free, originates from Netbeans, look for jvisualvm in JAVA_HOME/bin. It incorporates a memory profiler that uses a metric called “surviving generations” (or short “generations”). So what is a surviving generation?

Surviving generations:

The number of different ages for all objects allocated on the JVM heap since the profiling session started.

Age of object:

The age of the object is the number of garbage collections the object has survived.


Now the surviving generation metric is as good as it gets IMHO. A high number of SG tells that there isย  a high number of objects created which are never garbage collected (which is the definition of a memory leak, isn’t it?).

VisualVM displays the surviving generations metric, so it is easy to hunt them down.


To conclude:

  • Does it detect the slowly growing memory leak in the example above? Yes, it does!
  • VisualVM is only part of the Sun JDK, not of JRockit. Since we are all one happy family now I expect it survives the merging of both JDKs (Oracle is doing pretty well with these descisions usually. Hello Oracle …). Just in case it doesn’t survive I will keep posting references to this blog entry :).
  • Read more about JDK, WebLogic and monitoring (also the most important non-Oracle monitoring solutions) in my Oracle Middleware book.
  • I am regularly running a customized high-end Tuning, Sizing and Monitoring WebLogic workshop myself (preferably in Munich or Sydney). Drop me an email if you are interested.
  • I am off for a shower and the second coffee of the day. Enjoy the sunshine!

A live update on this from Oracle Open World 2011 as of Oct 3rd 2011. I just spoke to the tech lead of JRockit, Marcus Hirt, asked him about the support of surviving generations in the Jrockit Mission Control tooling for the merged JDK 7. His answer (with a very sympathic grin in his face) was: “Stay tuned…”.