WebLogic 12.1.2 Per Domain Nodemanger Command Line Arguments

Stepping out of any WebLogic admin training you will know that before WebLogic 12.1.2 we could start the node manager (NM) using its listen address and its port number as command-line arguments overwriting the settings in the nodemanager.properties file.

This is still possible, but doesn’t work OOTB for the per domain NM which was introduced in 12.1.2.

The reason is, that the start script in

DOMAIN_HOME/bin/startNodeManager.sh

is calling

WL_HOME/server/bin/startNodemanager.sh

The script located in WL_HOME is still okay, but the one in DOMAIN_HOME doesn’t forward the command-line parameters. So if you just want to be able to run it as before, then replace

${WL_HOME}/server/bin/startNodeManager.sh

with

${WL_HOME}/server/bin/startNodeManager.sh ${1} ${2}

in the startNodeManager.sh in DOMAIN_HOME/bin.

Have a great day!

ps. Are you observing this 12.1.2 NM bug? Let me know if you don’t.

IOPS Quality of Service for Amazon EBS Cloud Storage

Define the pipe!

You can now have EBS optimized EC2 instances with e.g.  500 or 1000 Mbit/sec throughput to EBS.

According to AWS a standard EBS volume will cope with 100 IOPS on average allowing some burts. As I mentioned before there was plenty of complaints and discussion about EBS performance workarounds though. Here is the news: AWS is offering provisioned IOPS EBS volumes. You can create up to 20 TB of provisioned IOPS volumes with a total of 10,000 IOPS per AWS account (but apply to extend your AWS account for more).

Seems like a lovely idea for a db data file, doesn’t it?

Does that make you run your EBS I/O benchmark again? Let me know about the results!

Simple Custom JMX MBeans with WebLogic 12c and Spring

Using the Spring framework bundled with WebLogic 12 the programming of JMX MBeans becomes as easy as writing a simple POJO within a web application. After coding the MBean as a POJO all that is left to do is creating the Spring configuration file and editing the web.xml deployment decriptor:

– Firstly you have to add the Spring <listener> to the web.xml deployment descriptor with the web.xml to get Spring started.

– Secondly create the applicationContext.xml for Spring in the WEB-INF subdirectory. Declare the Spring bean and let Spring export it to the platform MBean server.

– Thirdly deploy the web application and test it with JConsole, WLST or j4psh.

For your convinience I already built an example. You can download the deployable SimpleJMX.war file or the complete NetBeans project.

You can see the application in action, including the involved files and the deployment in the following screencast:

How to access custom MBeans from WLST is shown in the second part:

The third part is showing how to retrieve MBean attributes from a JSP:

Amazon Web Services (AWS) EC2 Autoscaling


How many blog posts have you read that were written on a ferry? Well this is post makes it one more. Live from famous Manly ferry since I am currently offering a number of Amazon and Oracle Cloud Computing Workshops in Australia.

Elasticity is a key criteria for cloud computing. Autoscaling is automated elasticity. Interesting enough is widely unknown how this will be implemented on the Oracle Public Cloud for the Java Service.

Autoscaling on AWS can only be configured with lengthy commands from the command line but not from the web cased AWS console. Getting all the parameters right can be tricky, so here is one of the easiest examples and a hands-on screen cast using it:


as-create-launch-config surfLaunch --region ap-southeast-1 --key access --image-id ami-b83374ea --instance-type t1.micro
as-create-auto-scaling-group surfScale --launch-configuration surfLaunch --region ap-southeast-1 -availability-zones ap-southeast-1a,ap-southeast-1b --min-size 2 --max-size 4
as-describe-auto-scaling-groups --headers --region ap-southeast-1

as-describe-auto-scaling-instances --headers --region ap-southeast-1
as-put-scaling-policy ScaleDown -auto-scaling-group surfScale --adjustment=-1 --type ChangeInCapacity --region ap-southeast-1
as-put-scaling-policy ScaleUp -auto-scaling-group surfScale --adjustment=+1 --type ChangeInCapacity --region ap-southeast-1


as-execute-policy ScaleUp --auto-scaling-group surfScale --region ap-southeast-1

as-describe-scaling-activities -g surfScale --region ap-southeast-1 --show-long


as-execute-policy ScaleUp --auto-scaling-group surfScale --region ap-southeast-1


mon-put-metric-alarm HighCPUAlarm --comparison-operator GreaterThanThreshold --evaluation-periods 1 --metric-name CPUUtilization --namespace "AWS/EC2" --period 600 --statistic Average --threshold 80 --alarm-actions "XXX" --dimensions "AutoScalingGroupName=surfScale" --region ap-southeast-1


mon-put-metric-alarm LowCPUAlarm --comparison-operator LessThanThreshold --evaluation-periods 1 --metric-name CPUUtilization --namespace "AWS/EC2" --period 600 --statistic Average --threshold 20 --alarm-actions "XXX" --dimensions "AutoScalingGroupName=surfScale" --region ap-southeast-1


REMOVE ALL:

as-update-auto-scaling-group surfScale --min-size 0 --max-size 0 --region ap-southeast-1
as-delete-auto-scaling-group surfScale --region ap-southeast-1

as-delete-launch-config surfLaunch --region ap-southeast-1


The comments section is open now for your suggestions how this will be done with the Oracle Public Cloud.

Another Myth Debunked: More than 200 Continuous Redeployments with WebLogic

The other day I overheard the myth that you simply cannot redeploy several times with WebLogic because inevitably you would end up having an out of memory error. Since I am currently writing on an WebLogic 12c book I decided to verify that.

Certainly this depends a lot on your heap settings and what your application is doing, eg. it is easier to get it wrong if you are writing your own classloaders etc. I certainly admit that these problems, if they occur, are particularly hard to sort out.

Hands-on Test

More important you should detect them early. So go and test it! It’s a simple 10 line WLST script. I have done it for you to verifiy if there is a general problem with redeployment in WebLogic.

I redeployed the MedRec application over 200 times. MedRec comes with the WebLogic 12c installation (only if you decide to install the samples). It consists of  over 20 EJBs, a web part and a few web services.

The sample domain can be found in the WL_HOME/samples/domains/medrec directory.

Download

A little WLST script that you can download does the trick (it’s a quick hack, you can certainly beautify and add error handling to it!). Download it (it comes zipped) and unzip it to the domain directory. It even contains comments about how to run it.

The script deploys the MedRec application (so undeploy it first!), waits for 30 seconds, undeploys, waits again and deploys again. At the same time it prints the number of loaded classes, heap and non-heap runtime values.

Results

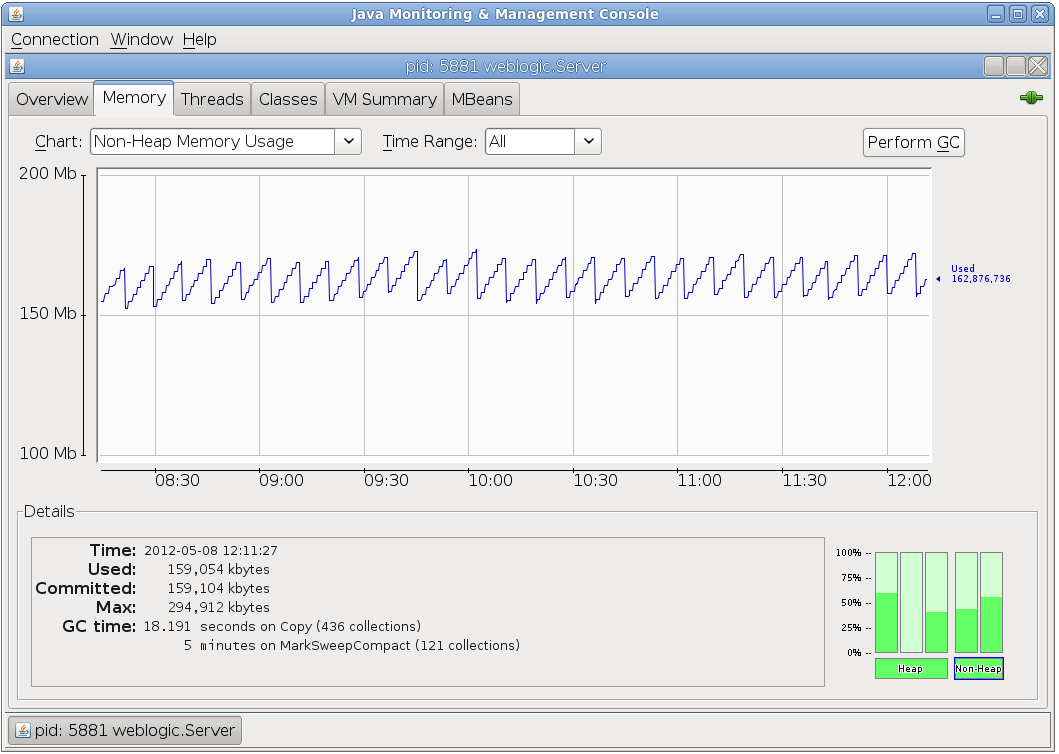
I was running this experiment for 200 redeployments. Apart from the output of the program, I recorded some data plots with jconsole.

The non-heap usage after 200 redeployments is shown on the following screenshot.

Everything was fine. I guess I could also do 1000 redeployments. I just stopped it because I got bored. I believe it would go on forever and I needed to shut down my computer.


Also here is the heap usage:


So test your own application deployment! It’s an easy test. IMHO it should be run for every important application. Add it to your tests when load testing the application.

Also I recommend to create some load for the app while it’s deployed. You may want shorten the interval between the deployments to a few seconds to get more deployments done faster.

Let me know if it breaks in your case 😉

Also stay informed about other exciting topics covered in the my WebLogic 12c book. I just created a Youtube channel with many WebLogic 12c screencasts (more to come every week).