WebLogic Stuck Threads: Creating, Understanding and Dealing with them

UPDATE: A lot has change over the years. I post a lot on medium now (bookmark it here, no excuse!). Also I have 80+ free webcasts on youtube (make sure to subscribe). Then all my slides went to speakerdeck. Yes. A lot is about THE cloud these days :-). For news: twitter.

Using the time off during the bank holidays over Easter I spent some time coding and looking into more unknown details of WebLogic stuck thread behavior. (Actually I started to write this posting because I was told by my doctor to keep my mouth shut for some days, but that’s another story…).

My personal task was to answer some of the most common questions I’ve encountered while consulting and running WebLogic 12c workshops. As often with my postings, this article is not meant to explain the basic concept of thread pools or workmanagers. I recommend to read the Oracle WebLogic 12c documentation about stuck thread handling first which explains how you can deal with stuck threads by configuring a workmanager.

Also there are some excellent details about stuck threads (including WLST scripting and monitoring) to be found at the Middleware Magic site – a site run by a group of really knowledgeable guys.

Now, typically customers tell me that they “observe some stuck threads”, “sometimes”, but often they are “not sure what caused them” and typically they “don’t know what exact state these thread are in” and in addition nobody seems to know if “the stuck threads ever clear up again without rebooting”. I am a pragmatic guy. I enjoy having little applications or tools to demonstrate and measure how WebLogic is working. Keen to play around with the newest edition of Netbeans (I used to be an Eclipse guy) and EJB 3.1 in WLS12c I built a small application to easily test WebLogic stuck thread settings and countermeasures.

Here are some more details about the StuckThreadForFree application:

  • The application allows you to create threads which are busy or which are waiting long enough to be detected as “stuck” by WebLogic.
  • This little application will only work with WLS12c. I intentionally avoided JSF, so a plain JSP page is used to set your parameters. The JSP is calling a simple Servlet which in a for loop is calling an asynchronous business method of an injected  stateless session bean. @Asynchronous and no-interface session beans are only available in EJB3.1 so you have to run it on WLS12c. Unlike in previous versions, the EJB is directly packaged into the .war file for deployment.
  • Every call to the stateless session bean is serialized by the EJB container, so every EJB method is executing in its own thread.
  • Depending on which method was called on the EJB is either waiting n seconds using Thread.sleep() or calculating some trigonometric function for n seconds. Both methods will cause stuck threads.
  • There is zero configuration in the deployment descriptors for the EJB! Only context-root for the web part is set (which could be avoided as well).
  • Building the StuckThreadForFree app with Netbeans was a smooth ride and a real pleasure.
  • The app is provided as is. You can have it for free, yet there is no guarantee for anything but it shouldn’t cause any problems either. Better don’t run it on your production system.
  • It’s just a hack. It demonstrates what it should, nothing else.

DOWNLOAD: for your conveninience you can download the StuckThreadForFree.war from here and follow the example yourself (here is the link to the whole Netbeans project). After downloading you can easily deploy it to WebLogic. To follow the example it’s good enough to run it the admin server. Then you can start with the following URL:

http://localhost:7001/StuckThreadForFree

Now, lets use the app to answer some typical questions.

What are hogging threads? When do threads become hogged? After what period of time?

According to the Oracle doc hogging threads “.. will either be declared as stuck after the configured timeout or will return to the pool before that. The self-tuning mechanism will backfill if necessary.”

So how long does it take for them to become hogged? Nobody (including Google) seemed to know. Trust me I did some research and asked plenty of colleagues about this. Here is the answer:

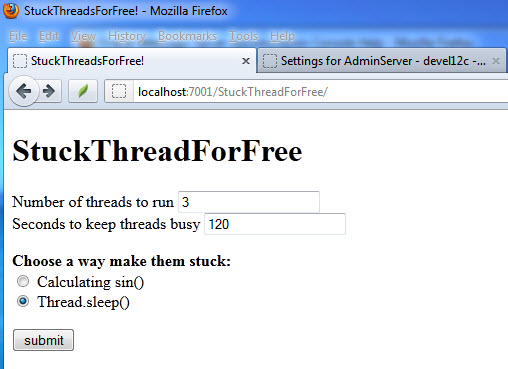
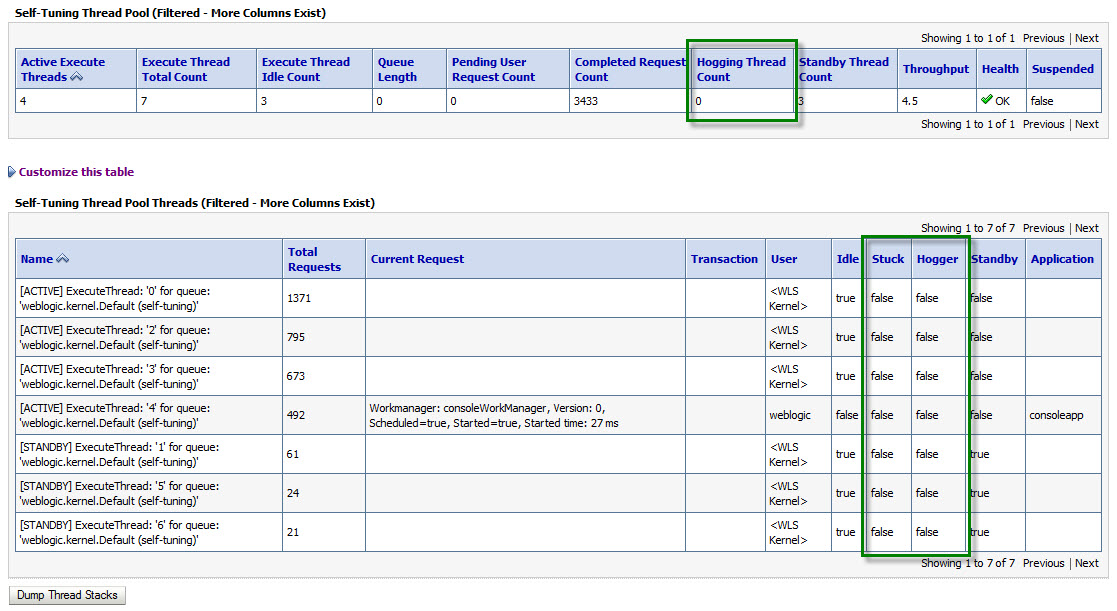
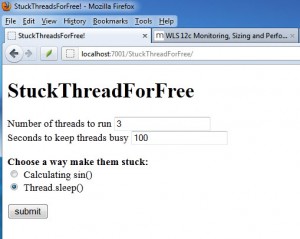
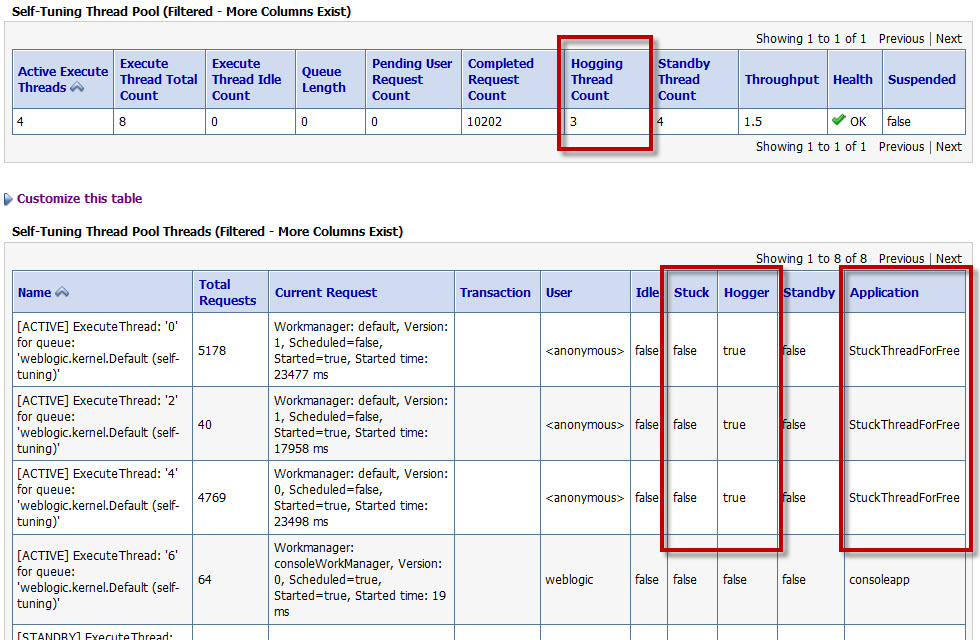
If you run the application with 3 threads / 100 seconds / Thread.sleep() and immediately switch to the WebLogic 12c admin console Admin Server / Monitoring / Threads you will observe the following:

So interestingly hogging threads are detected right away! In my case it took about 2 seconds (I had to hit reload once).

So WebLogic transitions into FAILED state when a certain number of stuck threads are detected, right? 

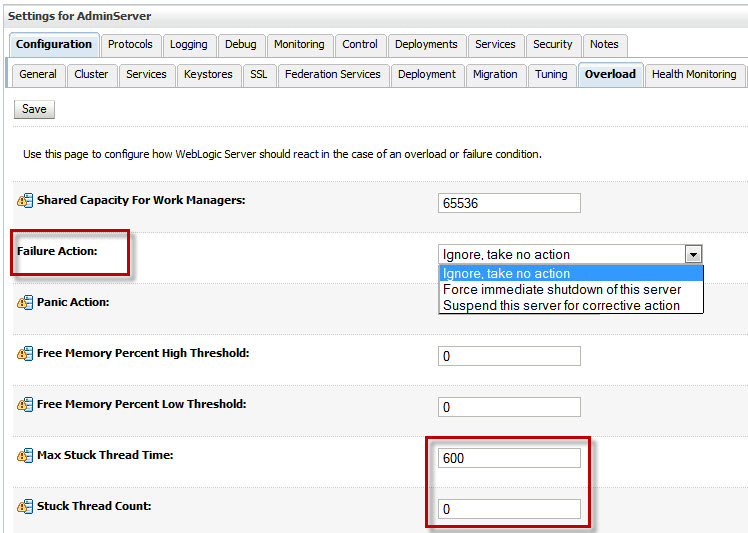
That’s a common misconception! The default configuration of WLS 12c (I also checked for WLS 11 = 10.3.3) is Stuck Thread Count = 0, which means the server “never transitions into FAILED server irrespective of the number of stuck threads”. You will only see the FAILED state only when you set the value to a positive number of threads!

Once the server transitions into FAILED, you can define if WLS should be shut down (and restarted by WLS nodemanager) or suspended.

Remember: WLS will not transition into FAILED state when StuckThreadCount is set to zero. Only the health runtime value is set to Warning (but this will be cleared if the hogging thread conditions clears) as shown below:

What exactly causes a stuck thread? What state does a thread have to be in to be marked as stuck?

In general there is a number of different thread states in Java: NEWRUNNABLEBLOCKEDWAITINGTIMED_WAITINGTERMINATED.

But which state has a thread to be in to be marked as stuck later? If you run the StuckThreadForFree application and create a stack trace with WebLogic admin console under Server / ServerName / Monitoring / Threads you can observe that the thread state is ACTIVE/TIMED_WAITING when using the Thread.sleep() method to block it:

"[ACTIVE] ExecuteThread: '5' for queue: 'weblogic.kernel.Default (self-tuning)'" TIMED_WAITING
            	java.lang.Thread.sleep(Native Method)
            	com.munzandmore.stuckthread.LongRunningEJB.threadSleep(LongRunningEJB.java:26)
            	com.munzandmore.stuckthread.LongRunningEJB_x9v26k_NoIntfViewImpl.__WL_invoke(Unknown Source)

when using the calc() method to keep the threads busy they are state ACTIVE/RUNNABLE :

"[ACTIVE] ExecuteThread: '0' for queue: 'weblogic.kernel.Default (self-tuning)'" RUNNABLE
            	com.munzandmore.stuckthread.LongRunningEJB.threadCalc(LongRunningEJB.java:40)
            	com.munzandmore.stuckthread.LongRunningEJB_x9v26k_NoIntfViewImpl.__WL_invoke(Unknown Source)
            	weblogic.ejb.container.internal.SessionLocalMethodInvoker.invoke(SessionLocalMethodInvoker.java:31)

So both states can become stuck. Also, I am pretty sure I could also show the BLOCKED state when using a monitor lock for synchronization but due to time restrictions this is not included in the app.

Can a stuck thread still do reasonable work?

Absolutely! Just because a thread is marked as stuck it doesn’t mean it is frozen or unusable. Imagine you wanted to calculate PI, you are creating PDFs, distance maps, mapping the human genome or you have deployed some JCA adapter talking to MQ-Series, SAP or PeopleSoft which is internally using a Thread.sleep() method call. All of this is are reasonable usages likely to occur in the wild.

Do stuck threads ever dissapear? Can they be cleared somehow? Are they stuck forever?

First of all you cannot get rid of a stuck thread by simply “killing it”. You cannot cancel or kill any thread in Java. However, stuck threads automatically will disappear if the condition clears up which caused them to be marked as stuck (e.g. the sleep period is over or the calculation is done).

To prove the point, switch to the WebLogic admin console and under Server / ServerName / Configuration set StuckThreadCount to 3 and StuckThreadTime to 60 seconds then restart the server and run the StuckThreadForFree app to create 3 threads running for 120 seconds using the Thread.sleep() method (the other method will work as well, there is no difference, but keeping 3 threads busy by doing math proves to be a fan test of your machine as well):

In the WebLogic log file you will find three entries logging the stuck thread state after a while:

<05.04.2012 10:55 Uhr MESZ> <Critical> <WebLogicServer> <BEA-000385> <Server health failed. Reason: health of
critical service 'Thread Pool' failed>
<05.04.2012 10:55 Uhr MESZ> <Error> <WebLogicServer> <BEA-000337> <[STUCK] ExecuteThread: '4' for queue: 'webl
ogic.kernel.Default (self-tuning)' has been busy for "85" seconds working on the request "Workmanager: default
, Version: 1, Scheduled=false, Started=true, Started time: 85443 ms
", which is more than the configured time (StuckThreadMaxTime) of "60" seconds. Stack trace:
 java.lang.Thread.sleep(Native Method)

After waiting about one minute you will observe that WebLogic  is transitioning into FAILED state as configured:

Wait another minute, then check the thread states under Server / ServerName / Monitoring / Threads which reveals the following:

So once the condition causing the stuck threads is cleared also the stuck threads will disappear again! Stuck threads are not stuck forever. Phew!

When should I use StuckThreadCount in the admin console or a Workmanager stuck-thread setting then?

Very good question. Use StuckThreadCount from the WebLogic admin console or with a <work-manager-shutdown-trigger> definition moving the application into ADMIN mode if you can react on the FAILED state.

Do not use StuckThreadCount if the threads might be doing something useful and you cannot react on the situation anyway. Obviously transitioning into FAILED state and restarting WLS with the nodemanager is counterproductive if you threads are doing something useful.

More?

The following posting shows how simple tools like ps, top and jcmd can track down the exact line of Java code causing a thread to use a high amount of CPU. Exactly the same StuckThreadForFree application is used as here.

Even More?

Update: There is great follow-up post now by Mark Otting showing you how to use WLST to monitor stuck threads, including a ready to run WLST script! Actually something I was talking about just a while ago at a customer site. Thanks to Mark you can download it.
Oracle WebLogic JMS Queues or AWS Cloud Simple Queue Service (SQS)

This is a shortened extract of my my book Middleware and Cloud Computing.


AWS Simple Queue Service

Amazon’s Simple Queue Service (SQS) is a cloud service for reliable messaging. The SQS service with its queues is located off-host. So, similar to the elastic load balancing service, or the relational database service, you can use the service without having to start an EC2 instance.

Features

SQS is available in all four AWS regions with the same pricing. All regions are independent of each other so messages can never be in-between regions. Queue names have to be unique per region.

Highly available

Queues are highly available: Messages waiting in queues for their delivery are stored redundantly on multiple servers and in multiple data centers.

Unlimited
queue size

There is no limit for the number of messages or the size of a particular queue. One message body can be up to 64 KB of text in any format (default is 8KB). For larger messages you have to store the message somewhere else reliably, e.g. in S3, SimpleDB or RDS, and pass around a reference to the storage location instead of passing the message itself.

Message expiry

When a message remains in a queue (because there is no receiver removing the message from the queue), the message expires after a default of four days (or a configurable maximum of 14 days).

After receiving a message from a queue, the message is locked for a configurable timeout. While the message is locked it is invisible to other receivers. SQS uses this mechanism to ensure that messages are delivered once.

It’s the receiver’s responsibility to explicitly delete the message when it is processed successfully. If the receiver fails before it is able to delete the message, then the message becomes visible again after the timeout, and another receiver can receive it.

Access to queues is restricted to the AWS account owners, but you can specify in an access policy statement that a queue will be shared.

No
compression
or encryption

Encryption is not a built-in SQS feature, but depending on your privacy requirements you can consider encrypting the content of your message at an application level. Also, there is no built-in compression feature, but you can compress large messages at an application level before sending them.

At least once
semantics

The message delivery semantic is engineered to be “at least once”. This means your applications have to cope with message duplicates.


Usage

Access to SQS is purely programmatic. Currently, there are no command-line tools from AWS, and there is no integration for SQS into the AWS management console yet.

There are language bindings for Java, PHP, Perl and C#. Also, the Java Typica library supports SQS.

SQS is ideal for decoupling systems or applications running on EC2. From a design perspective, SQS has many features in common with JMS queues. The most important differences between SQS and JMS queues are listed in Table 1.

Table 1: SQS Comparison with WLS Queues

SQS Queues WebLogic JMS Queues
Max queue size Unlimited Limit depends on JVM heap and persistent store
Best Quality of Service At least once Exactly-once
with transactions
Configurable retries No Yes
Persistence Always Optional
Scalability Inherent With distributed queues
Availability Inherent Whole-server migration 

or JMS service migration

Message Order Not guaranteed Can be enforced even for distributed queues
Configurable quotas No Yes
Configurable flow control No Yes
Auto acknowledge No Yes
Time To Live configuration 1h to 14d 1 ms to ca. 2 mio years
Max message size 64 KB Unlimited,
default is 10,000 KB
Compression No Yes
Billing Free usage tier, then charged per request and data transfer amount Included with WLS

Conclusion

To conclude, SQS is an AWS cloud service that could replace WebLogic JMS queues.

Compared to JMS queues, SQS has fewer features, no auto acknowledgement of messages and no support for exactly-once message delivery. The advantage of SQS over JMS queues is SQS’ inherent availability, the virtually unlimited storage for messages and the zero configuration.

The inherent availability is an especially important factor to consider when deciding between SQS or JMS queues, because the built-in features offered by WebLogic for achieving availability of JMS are restricted in today’s clouds.

SQS is implemented off-instance; therefore, its availability is not affected if a particular EC2 instance becomes unavailable.

SNS

Interestingly, there is a cloud service for the counterpart to JMS topics as well. The AWS Simple Notification Service allows you to send messages to more than one receiver using transport protocols such as HTTP, email and even SQS.

SQS vs. OSB

In case you are wondering how this relates to Oracle Service Bus: Comparing SQS with Oracle Service Bus is like comparing apples with oranges, because in addition to the built-in JMS, service bus also supports protocol adaption, message flows with content-based routing, and most importantly, it is configuration driven.

In a nutshell: SQS is a queue service for the AWS cloud to decouple systems with message passing. As a cloud service it abstracts the Java EE specific details of JMS – nevertheless SQS is specific to AWS. Currently there is no cloud messaging service offered for the Rackspace cloud. Using an AWS specific service like SQS increases the effort to migrate to another cloud provider (and limits your possibilities to quickly switch to another cloud provider as a part of a contingency plan).

Pricing

There is a free usage tier for up to 100,000 requests per month. Beyond that, Amazon adds $0.01 per 10,000 SQS requests to your bill.

In addition, you have to pay for the data transfer as shown the figure below. Only data transferred between SQS and EC2 within a single region is free. Data transferred between different regions will be charged at Internet data transfer rates on both ends.


More details on my Middleware and Cloud Computing book.


Amazon’s AWS outage – did the Cloud Fail?


There was a major outage in one of Amazon’s regions affecting several availability zones last Thursday.

– For a summary of the events and their impact see this blog entry of RightScale (I guess but I am not sure if it was written by Thorsten). The RightScale blog is updated now with some more details of the event.


– George Reese, the grand homme of Cloud Computing, calls this event a shining moment for clouds. Don’t get me wrong. I am big fan of George, not only because he is following me on twitter :). He gave a podcast interview repeating that you need to design for the cloud by designing for failure instead of sticking with your traditional architecture.

– Amazon did an poor job communicating what happened. Failures are a part of business but they have to be dealt with accordingly. Add this to your lessons learned list about Clouds. At least I did. Here is their summary.

In my Cloud Computing book there is a whole chapter about RightScale (who provided the best analysis so far) as well as a section about disaster recovery and another one on designing for clouds (“why it is not enough to simply run WebLogic on AWS”) . There is also a free chapter for download available at Oracle’s Archbeat site.

IMHO this event teaches us that it is not enough to know how to simply run WebLogic on AWS or any other IaaS cloud provider such as Rackspace. By the way, this is one of the reasons why my book has more than the initially planned 120 pages …

WebLogic 11g Overload Protection in the Cloud

WebLogic Overload Protection and OFM

[NEW in 2011: For more details please take a look at my book Middleware and Cloud Computing.]

Even when running your application in the cloud with the most careful capacity planning in place, autoscaling enabled, carefully tuned, well-written and load tested applications without any design flaws you better prepare yourself for instantaneous growth.

There is number of core WebLogic settings as well as various settings for the individual subcomponents of WebLogic such as JMS or JDBC that enable you to limit the effect of excessive load. I recommend to use the following enumeration of topics as a checklist for your own WebLogic settings. All of these settings apply to non-cloud environments as well.

The basic settings make sense for other Oracle Fusion Middleware products  as well which are running on top of WebLogic. Examples for these products are Oracle BPM, Service Bus, Service Registry and so on.

Some of these settings are documented at Oracle as well, but most are scattered throughout the PDFs.

Certainly there is much more to overload protection in the cloud such as dealing with offensive traffic from attackers, system architecture issues such as distributed JMS in the cloud or a service oriented application design that allows to dynamically disable non-critical parts of your application if  Armageddon is close to peak.

This article is a shortened excerpt from my upcoming cloud computing book.

Enable WebLogic Administration Port

Enabling the administration port is not the same as setting a port number for the admin server. Enabling the administration does the following: It reserves a thread and a separate port number for all administration communication within a  WebLogic server domain, enables SSL and disables non-SSL administration communication. Using the administration port feature increases the likelihood that admin server communication will be functional under high load.

Workmanager Capacity Constraint

WebLogic uses work managers with a variable and self-tuning number of worker threads. There is a default work manager but you can define your own work manager and assign a particular application or even a part of it such as a JSP to your custom work manager. When configuring a custom work manger you can add restrictions such as the minimum or maximum number of threads, a fair-share usage policy or a capacity constraint. The capacity constraint defines the maximum number of requests that can be queued or are executing at any given point in time.

Incoming requests that exceed the number of execute threads will be queued.

Incoming requests over the capacity constraint are rejected and result in a “503- Service Unavailable” response code for web applications. This capacity constraint can be shared across multiple work managers.

Maximum Request Queue Length

You can define a maximum queue length shared across all work managers with the setting “Shared Capacity For Work Managers” field in the WebLogic admin console. The default value of this field is 65536. This setting does not apply for the administration port, so you will not risk the access to the admin server even if the maximum number of requests queued is reached.

Maximum Thread Setting

Although the work managers use a self-tuning thread pool it is still possible to limit the upper bound of the pool. Note, that in general I reckon that the self-tuning work manger is doing fine and I do not recommend to set a maximum number of threads. However if your load test reveals that an excessive amount of threads will make your system slow or unstable, you could try to run your load test with a maximum constraint for the thread pool.

There is no way to set the maximum thread count directly from the WebLogic admin GUI, but you can provide an additional startup argument in your server start script:

-Dweblogic.threadpool.MaxPoolSize=500

You can achieve the same by editing the WebLogic config.xml in the config subdirectory of your WebLogic domain. Add the &ltself-tuning-thread-pool-size-max> element with the maximum number of threads to the <server> element. As always, make a backup copy and stop the admin server first before editing the config.xml because a running admin server will overwrite your changes.

Maximum Heap Setting and Panic Setting

Define the maximum heap size for the JVM with the –Xmx parameter. The maximum heap should never exceed the available physical memory in your machine since pageing for virtual memory will slow the system down extremely.

Define which percentage of free heap triggers an out of memory situation in the WebLogic admin console under Configuration / Overload. The “Panic Action” setting defines what action will be taken if an out of memory situation occurs. The default setting is “Ignore, take no action”, but you can change it to “Exit the server process” and let the nodemanager restart your server.

Restrict the number of HTTP sessions

For a WebLogic web application you can limit the maximum number of HTTP sessions created by setting the max-in-memory-sessions tag within the session-descriptor of the weblogic.xml file. Otherwise creating more and more sessions due to user requests can eventually cause an out of memory. When this number is exceeded, an weblogic.servlet.SessionCreationException is thrown for further attempts This setting applies to both replicated and non-replicated in-memory sessions.

Define JMS quota

Limit the number of pending JMS messages on a particular destination (queue or durable topic) by specifying a quota. Use a quota resource that defines byte and messages maximums and assign the quota to the destination.

There is also quota for destinations that do not explicitly set a value, these destinations share the quota of the JMS server

Specifying a Blocking Send Policy on JMS Servers

Specify for blocking sends whether all send requests for a particular destination are queued until space is available (FIFO setting). Then, no send request is permitted to complete when there is another send request is waiting for space.

With the preemptive setting a blocking send can preempt other blocking send operations if there is sufficient space available.

JMS Message Buffer Size

The Message Buffer Size option specifies how much of the heap memory JMS will consume to store message bodies before they are paged out to disk. There is a default for this setting of one-third of the maximum heap size for the JVM, or a maximum of 512 megabytes.

Writing JMS messages to disk will slow down JMS but prevent an out of memory. You trade in performance for stability.

Maximum Number of JDBC Database Connections

Set the maximum number of connections to the value determined by load testing the application (maximum number determined during load test plus some headroom). Set the initial size of the connection pool to the number of used connections.

Note, that the WebLogic JDBC pinned to thread feature is particularly dangerous in overload situations. With pinned to thread enabled for a connection pool the connections are not returned to the pool but remain attached to the execute thread. The pinned to thread feature will save connection wait time if there is a high competition for database connections for a busy connection pool but the number of database connections increase beyond the maximum number of connections set for the connection pool.