 This year I really kept the best until the end! Last week I was running a 2-day cloud computing workshop with a 2-hour hands-on management presentation the night before the workshop for Contribute in Belgium. Contribute is an Oracle Platinum partner and being surrounded by Oracle Fusion Middleware experts, DBAs, application architects and senior level management the technical level of the workshop was very high with many interesting discussions.
We covered Oracle Public Cloud (OPC), Amazon Web Services (AWS) and Rackspace (RS). OPC is not available yet, but the overall functionality including its limitations for the first release is more or less known and quite interesting compared to let’s say running WebLogic on AWS.
To prove the point I was running WebLogic 12c on AWS cloud with 30GB of heap on a high-mem 4xl instance with 8 cores. Proving the point cost me a bit more than US$2.
Typically I expected that the more tech savvy audience prefers AWS over Rackspace, yet this time people were impressed by the easy setup of Rackspace and the way they handled a minor problem with their web console file-upload feature during a live chat session.
Among hundreds of other details we looked at the I/O performance. The performance of Amazon’s EBS is known to be interesting (you may want to read this as ‘difficult’). See Adrian’s posting for a thorough explanation, some benchmarks here, and some more details there.
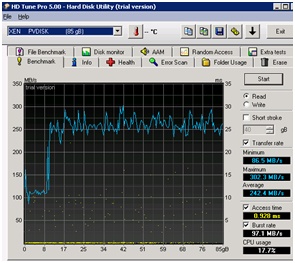
The out-of-the-box performance looking at Rackspace Cloud is more consistent and there is a surprisingly high throughput which is almost independent of the data size. Here is some data comparing a local laptop disk, to the disks attached to the Rackspace Cloud servers to my brand new consumer SSD (not sure if a 512 GB SSD still qualifies as ‘consumer’). All numbers refer to a READ-benchmark with increasing data size.
Laptop HD (500GB SATA): 80 MB/s
Laptop SSD (Crucial m4): 281 MB/s
Rackspace (SAN): 302 MB/s
I am only posting the screenshot for one of the Rackspace I/O measurements since quality isn’t perfect. There is some older data with graphs available in a previous post of mine.
Now I am still curious about the dip on the left part of the graph which is consistent over several instances and measurements. Any comments?


 Oracle WebLogic Server 12c Book
 Oracle Middleware and Cloud Computing Book
Speak Your Mind