Zero Downtime, REST, Domain Partitions / Multi Tenancy, Elasticity and WLDF. WebLogic 12.2.1 (12c)

I just finished a two week long hands-on consulting session for some pretty experienced application managers and architects.

In 5 days we explored WebLogic 12.2.1 extensively:

  • Zero Downtime
  • REST
  • Domain Partitions / Multi Tenancy
  • Resource Group Management
  • Java Mission Control
  • WLST
  • Elasticity
  • JMS Clustering
  • WLDF


p1

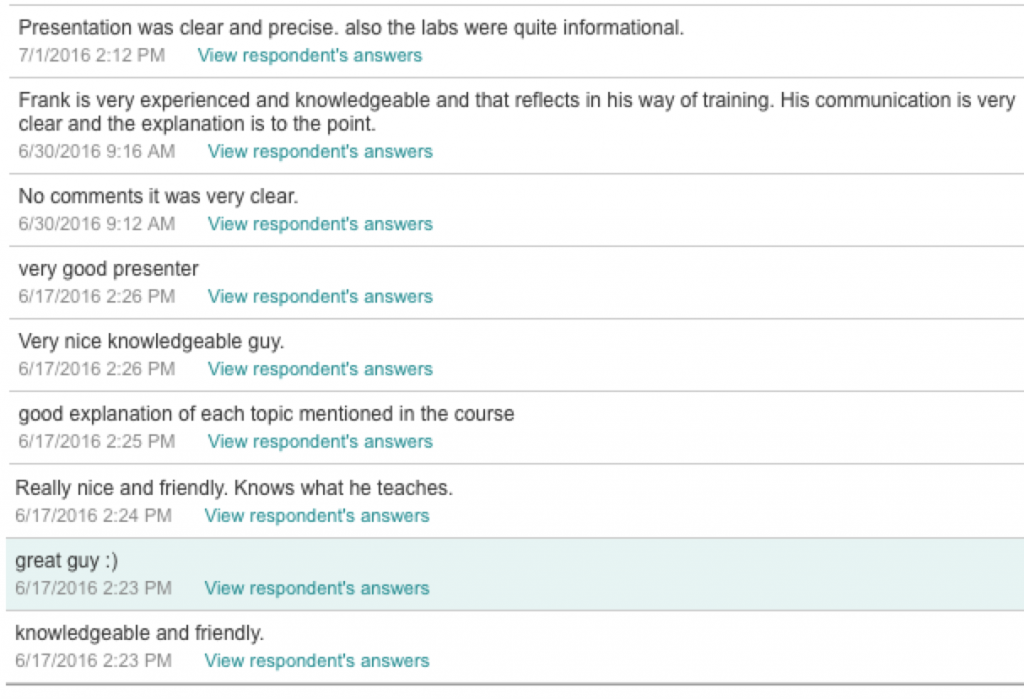
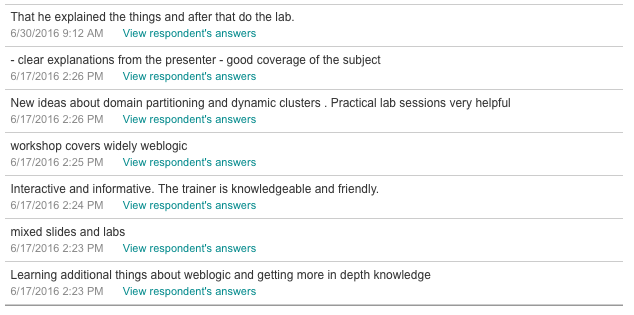
Here is some feedback from the group. You can tell we had fun, although we worked very hard.

Screen Shot 2016-07-04 at 10.43.06


This is how a happy group looks like.

group2


People seemed to be happy, here is what they liked.

Screen Shot 2016-07-04 at 10.44.13

For more details download the flyer from the Oracle WebLogic Server 12.2.1 (12c) course site.
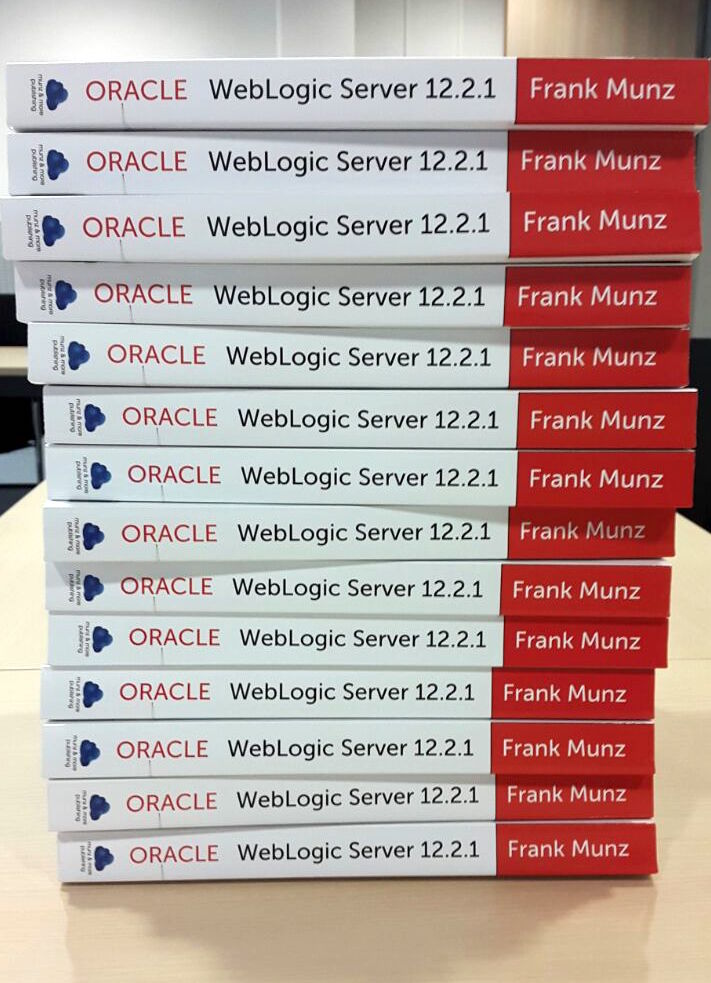
A Twitter Bootstrap Based Self-Measuring Application To Quantify the Effect of Precompilation on WebLogic – Part II

This is part II. It’s the part explaining how to measure the effect of precompilation.

The previous part, part I, covered the basics of precompilation. The next part, part III, will be about why even simple web applications should be different to what you and me were doing 10 years ago.

Measure the Effect of Precompilation

How NOT to do it

Don’t create a non-precompiled web application, run it with a load script that is simulating the requests of several clients, and then to compare run a precompiled version of the same web application with the same load. There is a rather big middleware vendor who is exactly showing this in a performance tuning course, but please folks, don’t try it at home.

There are quite a some reasons while at the end you cannot really measure a difference this way. To list a few: you load testing tool might record think times, several simulated clients won’t help, because after the first access the resource will be automatically compiled and so on.

A more clever way…

To measure how much time could be saved with precompilation I developed an application which is timing itself!

The application contains 10 JSP pages and automatically forwards from one JSP to another. The first JSP page will store the wall clock time and the last one will retrieve it and calculate the total execution time of the application. When running the application for the first time it will roughly take 9 times the time to precompile a JSP page plus 9 times the delay that the application is waiting until it is forwarding to the next JSP. Note, that you cannot measure the time to compile the first page, because it has to be compiled first before you can store the starting time.

precompilation

If you subtract the time the application is waiting until automatically forwarding  to the next page (a value arbitrarily set to 3 seconds here) and divide it by 9, you will have an estimation the average time it takes to precompile a single JSP.

Even better: if you run the exact application again, it is already precompiled! That’s a handy cross check. This way you can even quantify the time it takes to load the JSP page or the class file.

Measurement Results

On my small Lenovo X220 laptop with a SSD the compilation of a single JSP page cost more than half a second. When running the app for the first time I get the following results:

Without Precompile Results


For the second run the results look as follows:

res2

There is still some time needed per JSP but it is about 40 times smaller and more or less constant if you decide to run the precompiled version again.

Measure your own system, it’s an interesting benchmark. And let the world know – post your results here including your CPU, disk etc!


Hands-On Webcast

I recorded an a webcast showing how to use the application to measure the compilation time of  JSPs. You can watch the webcast using the following URL:

The application that is shown in this webcast above is a first prototype, without any design touches. Part III of this posting will explain who to achieve a beautifully looking design almost without any extra work!

Download the Application

The application that is provided to download here is the one that is described in part III of this posting. It has the same functionality but includes a tiny bit of web design using the Twitter Boostrap framework.

You can download the new and pretty application from the following location:

https://munzandmore.com/downloads/wls12book/ForwardBS.war

forwardbs

Conclusion

Not precompiling your apps will cost you more than half a second per JSP. Use the application above to benchmark your system.

For an application with 5000 JSPs you will waste an extra 40 minutes waiting.


A Twitter Bootstrap Based Self-Measuring Application To Quantify the Effect of Precompilation on WebLogic – Part I

Sounds cool, doesn’t it? Yet a bit academic – I agree. So why this title? It is as precise as it gets. And it’s less 140 chars, so I can even tweet it. Yet no worries, I’ll enjoy dissecting the headline for. There are a number of important messages. To make it more readable I will split it into three parts.

  • So let’s get to the topic right away (which by the way is precompilation).
  • To prove it makes a real difference, I will show in part II how you can measure the effect of precompilation since quite often people fail to do so.
  • Later in the cool part, part III, we look at some exciting bells and whistles for web applications (Twitter Bootstrap framework).

Precompilation

Why would you precompile your application?

Precompilation isn’t really necessary to make an application work correctly. WebLogic will compile necessary artifacts when they are needed. For example a JSP page which is not precompiled will be compiled at the time it is accessed.

Deploying an application without precompilation forces you to use lame excuses such as “It’s a bit slow right now, because it is running for the first time after deployment“. I am sure you don’t want to be remembered for lame comments. Running your applications without precompilation costs you time. And time is expensive.

What is the difference between precompilation and compilation?

Well, every Java class has to be compiled before it is executed by the JVM. The .java file is converted into a .class file. Other stuff, such as a JSP page could be deployed as is. It will then be compiled by WebLogic.

What can be precompiled?

If you don’t want to think about it, simply precompile your .war or .ear files. JSPs, web service artefacts and EJBs can be precompiled. Let’s look at the JSPs in more detail:

The JSP is converted into a servlet Java file which in turn is compiled into a .class file.

precompile a JSP

Precompilation after deployment?

You can request WebLogic to precompile your application right after deployment. To do so set the XML element <precompile>true</precompile> in the weblogic.xml deployment descriptor.

Many projects seem to use this solution, but it is certainly not the best idea. There are at least two reasons why I am not a big fan of this solution.

1.) Using the setting mentioned above precompilation happens right after deployment. This is the time when you want to show off your application. However, the application is not precompiled yet. Even worse, during precompilation system resources are used and the application is slowed down.

2.) When setting the <precompile> element, the application is precompiled after redeployment and after server restart. Do you really want your application to be precompiled after every server start?

Precompilation before deployment!

I recommend to precompile before you deploy. If building your application takes a long time, precompiling will make the process even longer. Then consider to have two different build targets: One for quickly testing your application without precompile, another one with precompile for load testing and deploying your application in an production environment.

After setting an environment suitable for running WebLogic commands from the command-line, all artifacts for an application surf.ear can be precompiled as follows:

java weblogic.appc surf.ear

Note, that the former JSP precompiler weblogic.jspc is deprecated.

Sometimes JSP fragments are included within a JSP yet these JSP fragments are not syntactically correct JSPs. Now if the fragments have a .jsp extension the precompiler will try to compile them and fail, therefore you should set the tag <precompile-continue>. Then precompilation will continue on errors.

Also there are faster compilers than javac. You can specify a different compiler with the switch -compiler.

Precompilation with Maven

If you use Maven to manage yours builds, Maven can call the application compiler appc for you when building you application. So everything in the paragraph above applies to building your application with Maven as well.

Possible Problems

If you precompile the deployment module before deploying, the classes will be added to the module and you should never see WebLogic compiling them again.

In case you are having problems with reoccurring precompilation, check the following issues:

  • Verify that the JDK version used to precompile is exactly the same as the JDK used to run WebLogic.
  • Make sure the time on the machine used for precompilation is synchronized with the machine where the application is deployed.

Conclusion

Precompilation isn’t a new topic, however it is often done the wrong way or it is not done at all.

Always precompile your deployments unless you manually create a quick distribution for testing during development. Don’t precompile using the <precompile> deployment descriptor after server start.

Add the precompile step into your continuous build process.

Additional Links:

WebLogic 12c deployment descriptor documentation for precompile:

http://docs.oracle.com/cd/E24329_01/web.1211/e21049/weblogic_xml.htm

Using WebLogic Maven plugin:

http://docs.oracle.com/cd/E24329_01/web.1211/e24368/maven.htm

WebLogic Maven appc goal:

http://docs.oracle.com/cd/E24329_01/web.1211/e24368/maven.htm#CHEBEHEH

DevOps Basics I: Track Down High CPU Thread with ps, top and the new JDK7 jcmd Tool.

I captured the following webcast last night. I was writing about how a clever combination of simple tools like ps, top and jcmd can help to track down the Java code that is causing a thread to consume a high amount CPU time.

The approach is very generic and works for WebLogic, Glassfish or any other Java application. UNIX commands in the example are run on CentOS, so they will work without changes for Oracle Enterprise Linux or RedHat.
Creating the thread dump at the end of the video is done with the jcmd tool from JDK7.

The webcast uses the StuckThreadForFree sample application which is specific for WebLogic 12c and can be downloaded from my stuck thread recipe.

WebLogic Stuck Threads: Creating, Understanding and Dealing with them

UPDATE: A lot has change over the years. I post a lot on medium now (bookmark it here, no excuse!). Also I have 80+ free webcasts on youtube (make sure to subscribe). Then all my slides went to speakerdeck. Yes. A lot is about THE cloud these days :-). For news: twitter.

Using the time off during the bank holidays over Easter I spent some time coding and looking into more unknown details of WebLogic stuck thread behavior. (Actually I started to write this posting because I was told by my doctor to keep my mouth shut for some days, but that’s another story…).

My personal task was to answer some of the most common questions I’ve encountered while consulting and running WebLogic 12c workshops. As often with my postings, this article is not meant to explain the basic concept of thread pools or workmanagers. I recommend to read the Oracle WebLogic 12c documentation about stuck thread handling first which explains how you can deal with stuck threads by configuring a workmanager.

Also there are some excellent details about stuck threads (including WLST scripting and monitoring) to be found at the Middleware Magic site – a site run by a group of really knowledgeable guys.

Now, typically customers tell me that they “observe some stuck threads”, “sometimes”, but often they are “not sure what caused them” and typically they “don’t know what exact state these thread are in” and in addition nobody seems to know if “the stuck threads ever clear up again without rebooting”. I am a pragmatic guy. I enjoy having little applications or tools to demonstrate and measure how WebLogic is working. Keen to play around with the newest edition of Netbeans (I used to be an Eclipse guy) and EJB 3.1 in WLS12c I built a small application to easily test WebLogic stuck thread settings and countermeasures.

Here are some more details about the StuckThreadForFree application:

  • The application allows you to create threads which are busy or which are waiting long enough to be detected as “stuck” by WebLogic.
  • This little application will only work with WLS12c. I intentionally avoided JSF, so a plain JSP page is used to set your parameters. The JSP is calling a simple Servlet which in a for loop is calling an asynchronous business method of an injected  stateless session bean. @Asynchronous and no-interface session beans are only available in EJB3.1 so you have to run it on WLS12c. Unlike in previous versions, the EJB is directly packaged into the .war file for deployment.
  • Every call to the stateless session bean is serialized by the EJB container, so every EJB method is executing in its own thread.
  • Depending on which method was called on the EJB is either waiting n seconds using Thread.sleep() or calculating some trigonometric function for n seconds. Both methods will cause stuck threads.
  • There is zero configuration in the deployment descriptors for the EJB! Only context-root for the web part is set (which could be avoided as well).
  • Building the StuckThreadForFree app with Netbeans was a smooth ride and a real pleasure.
  • The app is provided as is. You can have it for free, yet there is no guarantee for anything but it shouldn’t cause any problems either. Better don’t run it on your production system.
  • It’s just a hack. It demonstrates what it should, nothing else.

DOWNLOAD: for your conveninience you can download the StuckThreadForFree.war from here and follow the example yourself (here is the link to the whole Netbeans project). After downloading you can easily deploy it to WebLogic. To follow the example it’s good enough to run it the admin server. Then you can start with the following URL:

http://localhost:7001/StuckThreadForFree

Now, lets use the app to answer some typical questions.

What are hogging threads? When do threads become hogged? After what period of time?

According to the Oracle doc hogging threads “.. will either be declared as stuck after the configured timeout or will return to the pool before that. The self-tuning mechanism will backfill if necessary.”

So how long does it take for them to become hogged? Nobody (including Google) seemed to know. Trust me I did some research and asked plenty of colleagues about this. Here is the answer:

If you run the application with 3 threads / 100 seconds / Thread.sleep() and immediately switch to the WebLogic 12c admin console Admin Server / Monitoring / Threads you will observe the following:

So interestingly hogging threads are detected right away! In my case it took about 2 seconds (I had to hit reload once).

So WebLogic transitions into FAILED state when a certain number of stuck threads are detected, right? 

That’s a common misconception! The default configuration of WLS 12c (I also checked for WLS 11 = 10.3.3) is Stuck Thread Count = 0, which means the server “never transitions into FAILED server irrespective of the number of stuck threads”. You will only see the FAILED state only when you set the value to a positive number of threads!

Once the server transitions into FAILED, you can define if WLS should be shut down (and restarted by WLS nodemanager) or suspended.

Remember: WLS will not transition into FAILED state when StuckThreadCount is set to zero. Only the health runtime value is set to Warning (but this will be cleared if the hogging thread conditions clears) as shown below:

What exactly causes a stuck thread? What state does a thread have to be in to be marked as stuck?

In general there is a number of different thread states in Java: NEWRUNNABLEBLOCKEDWAITINGTIMED_WAITINGTERMINATED.

But which state has a thread to be in to be marked as stuck later? If you run the StuckThreadForFree application and create a stack trace with WebLogic admin console under Server / ServerName / Monitoring / Threads you can observe that the thread state is ACTIVE/TIMED_WAITING when using the Thread.sleep() method to block it:

"[ACTIVE] ExecuteThread: '5' for queue: 'weblogic.kernel.Default (self-tuning)'" TIMED_WAITING
            	java.lang.Thread.sleep(Native Method)
            	com.munzandmore.stuckthread.LongRunningEJB.threadSleep(LongRunningEJB.java:26)
            	com.munzandmore.stuckthread.LongRunningEJB_x9v26k_NoIntfViewImpl.__WL_invoke(Unknown Source)

when using the calc() method to keep the threads busy they are state ACTIVE/RUNNABLE :

"[ACTIVE] ExecuteThread: '0' for queue: 'weblogic.kernel.Default (self-tuning)'" RUNNABLE
            	com.munzandmore.stuckthread.LongRunningEJB.threadCalc(LongRunningEJB.java:40)
            	com.munzandmore.stuckthread.LongRunningEJB_x9v26k_NoIntfViewImpl.__WL_invoke(Unknown Source)
            	weblogic.ejb.container.internal.SessionLocalMethodInvoker.invoke(SessionLocalMethodInvoker.java:31)

So both states can become stuck. Also, I am pretty sure I could also show the BLOCKED state when using a monitor lock for synchronization but due to time restrictions this is not included in the app.

Can a stuck thread still do reasonable work?

Absolutely! Just because a thread is marked as stuck it doesn’t mean it is frozen or unusable. Imagine you wanted to calculate PI, you are creating PDFs, distance maps, mapping the human genome or you have deployed some JCA adapter talking to MQ-Series, SAP or PeopleSoft which is internally using a Thread.sleep() method call. All of this is are reasonable usages likely to occur in the wild.

Do stuck threads ever dissapear? Can they be cleared somehow? Are they stuck forever?

First of all you cannot get rid of a stuck thread by simply “killing it”. You cannot cancel or kill any thread in Java. However, stuck threads automatically will disappear if the condition clears up which caused them to be marked as stuck (e.g. the sleep period is over or the calculation is done).

To prove the point, switch to the WebLogic admin console and under Server / ServerName / Configuration set StuckThreadCount to 3 and StuckThreadTime to 60 seconds then restart the server and run the StuckThreadForFree app to create 3 threads running for 120 seconds using the Thread.sleep() method (the other method will work as well, there is no difference, but keeping 3 threads busy by doing math proves to be a fan test of your machine as well):

In the WebLogic log file you will find three entries logging the stuck thread state after a while:

<05.04.2012 10:55 Uhr MESZ> <Critical> <WebLogicServer> <BEA-000385> <Server health failed. Reason: health of
critical service 'Thread Pool' failed>
<05.04.2012 10:55 Uhr MESZ> <Error> <WebLogicServer> <BEA-000337> <[STUCK] ExecuteThread: '4' for queue: 'webl
ogic.kernel.Default (self-tuning)' has been busy for "85" seconds working on the request "Workmanager: default
, Version: 1, Scheduled=false, Started=true, Started time: 85443 ms
", which is more than the configured time (StuckThreadMaxTime) of "60" seconds. Stack trace:
 java.lang.Thread.sleep(Native Method)

After waiting about one minute you will observe that WebLogic  is transitioning into FAILED state as configured:

Wait another minute, then check the thread states under Server / ServerName / Monitoring / Threads which reveals the following:

So once the condition causing the stuck threads is cleared also the stuck threads will disappear again! Stuck threads are not stuck forever. Phew!

When should I use StuckThreadCount in the admin console or a Workmanager stuck-thread setting then?

Very good question. Use StuckThreadCount from the WebLogic admin console or with a <work-manager-shutdown-trigger> definition moving the application into ADMIN mode if you can react on the FAILED state.

Do not use StuckThreadCount if the threads might be doing something useful and you cannot react on the situation anyway. Obviously transitioning into FAILED state and restarting WLS with the nodemanager is counterproductive if you threads are doing something useful.

More?

The following posting shows how simple tools like ps, top and jcmd can track down the exact line of Java code causing a thread to use a high amount of CPU. Exactly the same StuckThreadForFree application is used as here.

Even More?

Update: There is great follow-up post now by Mark Otting showing you how to use WLST to monitor stuck threads, including a ready to run WLST script! Actually something I was talking about just a while ago at a customer site. Thanks to Mark you can download it.