Management and monitoring of WebLogic resources is a day-to-day challenge for many administrators. Programming a management solution by writing JMX code in Java is a low-level and time consuming process which can be best avoided using the Jython based WebLogic scripting tool (WLST).
WLST is a higher level, domain specific language (DSL) especially developed to address management issues. A few lines of WLST code typically encapsulate hundreds of lines of Java code using JMX. Although WLST is compact and easy to write it still suffers from the “J” in JMX: Every time you execute a WLST script to monitor some attribute on the application server a JVM has to be started on the client side for WLST. This overhead can become quite substantial if you are monitoring many servers and retrieving attributes at regular intervals. In particular for monitoring systems such as Nagios (or the newer Shinken) the WLST approach is not suitable.
WebLogic 12c RESTful Management Service
One of the distinguishing new features of WebLogic 12c is its RESTful management service which can be enabled by a simple click under DOMAIN / Configuration / General / Advanced / Enable RESTful Management Services followed by a server restart.
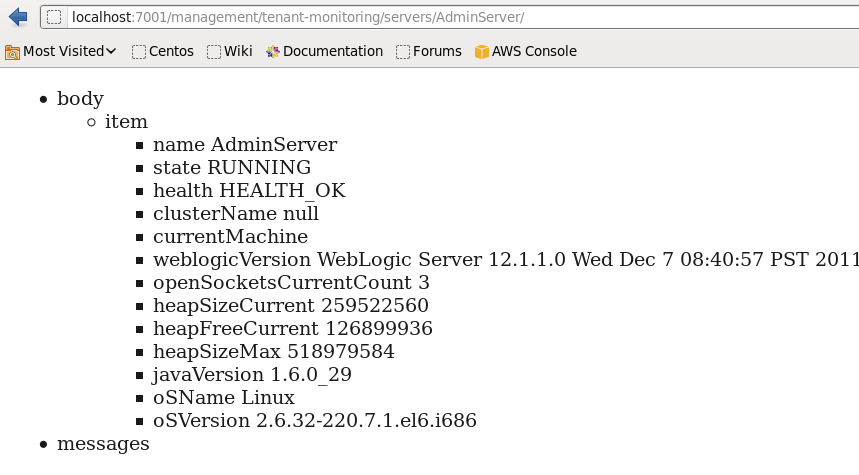
Once enabled, you can access the most important WebLogic 12c runtime values using a simple URL syntax from your web browser or a Unix command line tool such as curl. For example you can retrieve runtime data of the administration server with fast HTTP request instead of spawning a JVM process for WLST:
http://localhost:7001/management/tenant-monitoring/servers/AdminServer/
Jolokia
Basics
WebLogic 12c RESTful management is an easy and convinient start, yet there is more possible. The open source framework Jolokia was named after of one of the the hottest chilis on the planet. Jolokia is the kind of chili that most people agree better not to eat (it’s still useful, e.g. to produce military grade tear gas and marine paint).
(Image source: courtesy of R. Huss / Jolokia)
The project is best described by the its developer:
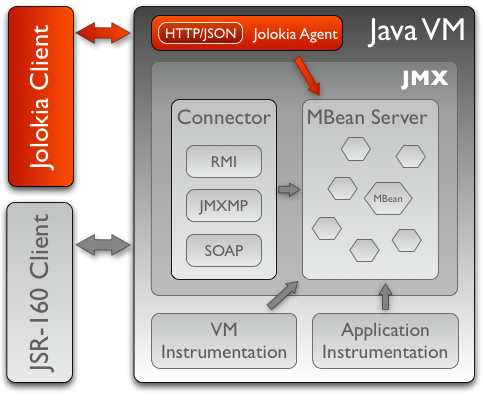
“Jolokia is an agent based approach for remote JMX access. It is an alternative to standard JSR 160 connectors. The communication between client and agent goes over HTTP (either GET or POST), where the request and response payload is represented in JSON. The Jolokia protocol supports the following operations:
– Reading and writing JMX attributes
– Execution of JMX operations
– Searching for MBean Names by pattern
– Listing of MBean Meta-data like supported attributes, operations and notifications”
Installation
The installation process is well described at the Jolokia site. You can simply get the jolokia.war file from the Jolokia download site or the Maven central repository, nothing else is needed for WebLogic.
It’s even possible to use it without any deployment at all. Starting with JDK6 you can run it as an JVM agent, a technique typically used for profilers etc. So your java call starting WebLogic has the following format:
java -javaagent:agent.jar ...
If you like to install the whole Jolokia project (including the JMX shell described later, the Nagios plugin, a Spring Roo addon etc) on a UNIX system with Perl and CPAN already installed it can be as easy as:
[root@ccloud ~]# perl -MCPAN -e shell cpan shell -- CPAN exploration and modules installation (v1.9800)
cpan[1]> install JMX:Jmx4Perl
[... you have to confirm the installation of several dependencies ...]
cpan[2]> exit
After building the Jolokia module it can download the jolokia.war which is then deployed to WebLogic. In case you are playing with an admin server running in development only move it to the DOMAIN_NAME/autodeploy directory otherwise deploy it via the administration console to all servers in the domain:
oracle@ccloud [~]$ jolokia download * Loading Jolokia meta data from http://www.jolokia.org/jolokia.meta * Good PGP signature (EF101165) * Using Jolokia 1.0.3 for Jmx4Perl 1.04 * Downloading war agent version 1.0.3 from repository http://labs.consol.de/maven/repository * Saved ./jolokia.war * Good PGP signature (EF101165)Feature Comparison: Jolokia and WebLogic 12c RESTful Management Service
Now, how does Jolokia compare to what you already have out of the box in WebLogic 12c? Here is a short overview:
|
WebLogic 12c |
Jolokia |
|
| Installation | Not required: enable from admin console |
Simple installation: deploy prebuilt jolokia.war |
| Availability | Only for WebLogic 12c | Multi vendor, multi version support:
|
| Approach | Central (available on admin server only) |
Can be distributed (target on every server in domain) |
| Access syntax | Easy, proprietary URL format | Standard MBean name |
| Return format | HTML, JSON, XML | JSON |
| Accessible Data | Servers, Clusters, Deployed Apps, DataSources Not supported: JMS |
All accessable MBeans and attributes |
| Security | Requires authentication with admin or monitor role |
Standard web based security (can be restricted to certain IPs, roles, HTTPprotocols, etc.) |
| Documentation | Oracle documentation | Very good online documentation |
| Access for single attributes only example: HeapMemoryUsage |
No | Yes |
| Access for inner path example HeapMemoryUsage/max |
No | Yes |
| Bulk requests | No | Yes (One HTTPrequest for different MBeans is translated into multiple JMX requests within WebLogic JVM and yet one result is returned) |
| Additional utilities | JMX shell j4psh Nagios plugin check_jmx4perl |
Jolokia Request
The GET URL for a Jolokia read request has the following format:
<base-url>/read/<mbean name>/<attribute name>/<inner path>
To get started just paste the following URL into your browser or use the Unix command line utility curl (assuming you have the admin server running at localhost:7001). It will retrieve the configured ListenPort attributes:
http://localhost:7001/jolokia/read/com.bea:*,Type=Server/ListenPort
which will return the following result for a WebLogic domain with 3 managed servers configured:
{ "request" : { "attribute" : "ListenPort", "mbean" : "com.bea:Type=Server,*", "type" : "read" }, "status" : 200, "timestamp" : 1334776908, "value" : { "com.bea:Name=AdminServer,Type=Server" : { "ListenPort" : 7001 }, "com.bea:Name=surf1,Type=Server" : { "ListenPort" : 7003 }, "com.bea:Name=surf2,Type=Server" : { "ListenPort" : 7005 }, "com.bea:Name=surf3,Type=Server" : { "ListenPort" : 7007 } } }Your response will be displayed in a single line. To get the format above you can past the result into one of the many online JSON formatters (or pipe the curl output to an appropriate utility).
Also I recommend to have a look at some examples about how to use Jolokia from Java, Perl and JavaScript.
Now continue reading part II of this posting with examples showing how to use Jolokia to retrieve monitoring values for servers, deployments, JDBC and JMS.
[This posting will be part of my upcoming WebLogic 12c book]

 Oracle WebLogic Server 12c Book
 Oracle Middleware and Cloud Computing Book
I just saw that Rene has written an article about Jolokia as well. This is good news since Jolokia deserves some more attention and of course I always enjoy to spark some interest in WLS related open source tools.
Read it at the Middleware Magic site (which you should bookmark anyway!):
http://middlewaremagic.com/weblogic/?p=7993
best,
Frank