This is part II. It’s the part explaining how to measure the effect of precompilation.
The previous part, part I, covered the basics of precompilation. The next part, part III, will be about why even simple web applications should be different to what you and me were doing 10 years ago.
Measure the Effect of Precompilation
How NOT to do it
Don’t create a non-precompiled web application, run it with a load script that is simulating the requests of several clients, and then to compare run a precompiled version of the same web application with the same load. There is a rather big middleware vendor who is exactly showing this in a performance tuning course, but please folks, don’t try it at home.
There are quite a some reasons while at the end you cannot really measure a difference this way. To list a few: you load testing tool might record think times, several simulated clients won’t help, because after the first access the resource will be automatically compiled and so on.
A more clever way…
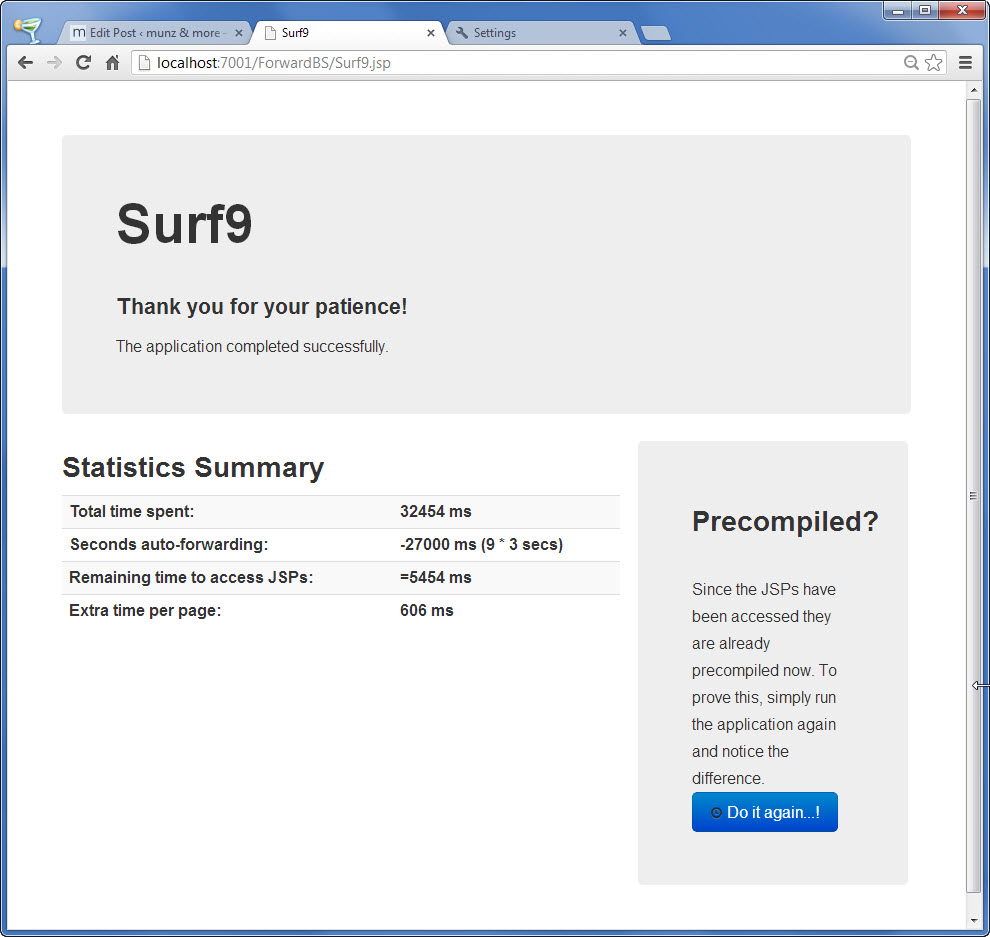
To measure how much time could be saved with precompilation I developed an application which is timing itself!
The application contains 10 JSP pages and automatically forwards from one JSP to another. The first JSP page will store the wall clock time and the last one will retrieve it and calculate the total execution time of the application. When running the application for the first time it will roughly take 9 times the time to precompile a JSP page plus 9 times the delay that the application is waiting until it is forwarding to the next JSP. Note, that you cannot measure the time to compile the first page, because it has to be compiled first before you can store the starting time.

If you subtract the time the application is waiting until automatically forwarding to the next page (a value arbitrarily set to 3 seconds here) and divide it by 9, you will have an estimation the average time it takes to precompile a single JSP.
Even better: if you run the exact application again, it is already precompiled! That’s a handy cross check. This way you can even quantify the time it takes to load the JSP page or the class file.
Measurement Results
On my small Lenovo X220 laptop with a SSD the compilation of a single JSP page cost more than half a second. When running the app for the first time I get the following results:
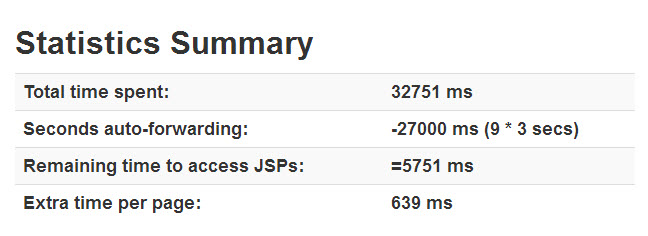
For the second run the results look as follows:
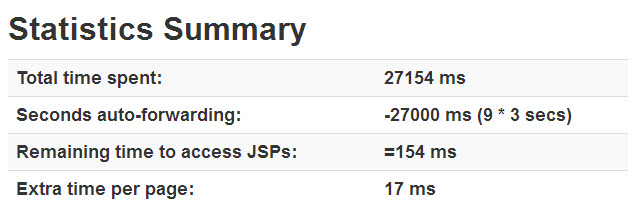
There is still some time needed per JSP but it is about 40 times smaller and more or less constant if you decide to run the precompiled version again.
Measure your own system, it’s an interesting benchmark. And let the world know – post your results here including your CPU, disk etc!
Hands-On Webcast
I recorded an a webcast showing how to use the application to measure the compilation time of JSPs. You can watch the webcast using the following URL:
The application that is shown in this webcast above is a first prototype, without any design touches. Part III of this posting will explain who to achieve a beautifully looking design almost without any extra work!
Download the Application
The application that is provided to download here is the one that is described in part III of this posting. It has the same functionality but includes a tiny bit of web design using the Twitter Boostrap framework.
You can download the new and pretty application from the following location:
https://munzandmore.com/downloads/wls12book/ForwardBS.war
Conclusion
Not precompiling your apps will cost you more than half a second per JSP. Use the application above to benchmark your system.
For an application with 5000 JSPs you will waste an extra 40 minutes waiting.

 Oracle WebLogic Server 12c Book
 Oracle Middleware and Cloud Computing Book
Speak Your Mind